Exponential Growth
Exponential Growth
Growth Example 2
Continued
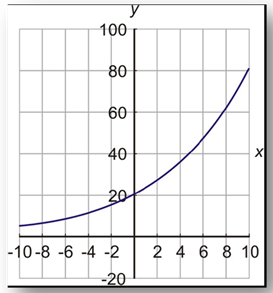
Step 5. Graph the function.

*Note: Negative values of x are graphed on this graph. In this case, x = ? 5 represents what the population was five years ago, so it can be useful information. Also, the scale of the y-axis is in thousands.