Displaying Data
Displaying Data
Misleading Graphs
Example 2
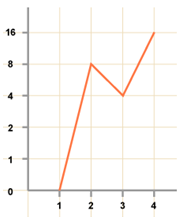
What makes this graph misleading?

Step 1. Look at the graph critically for misleading information in the scale, increments, or labels.
Although the vertical scale starts at 0, it does not go up in even steps. This distorts the graph, and makes it look as though the biggest jump is between 1 and 2, rather than 3 and 4.
Also, there are no labels on the axes, so we have no idea what this graph represents!