Graphs
| Site: | Harrison |
| Course: | Michigan Algebra I Sept. 2012 |
| Book: | Graphs |
| Printed by: | Guest user |
| Date: | Saturday, 31 January 2026, 4:06 AM |
Description
Graphs
Graphs
Example 1
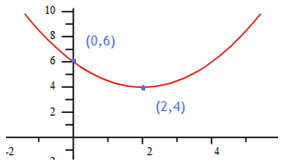
Step 1. Choose the appropriate form.
For this graph, the vertex is known so vertex form is appropriate.
Step 2. Use the formula and the vertex to find the a-value.
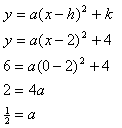
Step 3. Write a model.
![]()
Example 2
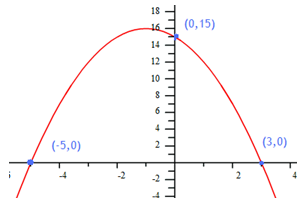
Step 1. Choose the appropriate form.
For this graph, the x-intercepts are known so factored form is appropriate.
Step 2. Substitute the x-intercepts into the formula to find the a-value.

Step 3. Write a model.
![]()
Projectile Motion
h(t) = -16t2 +vt + s
In this equation, h represents the height, t is time, v is the initial velocity, and s is the starting height. Gravity of the earth, at 32 ft/sec2, is represented by the -16 coefficient of the squared term.
In every equation using earth's gravity, the coefficient of the quadratic term is negative. Gravity is bringing the object to the ground even if it is shot upward. The U-shaped curve opens down.
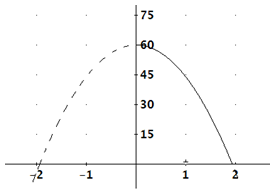
Example 1
Step 1. Determine the initial height of the object and its initial velocity.
The initial height, s, is 60 feet. The initial velocity, v, is 0 since the object was dropped, not thrown.
Step 2. Substitute these values into the formula.
h(t) = -16t2 + 0t + 60
Step 3. Make the graph.
Example 2
Step 1. Determine the initial height of the object and its initial velocity.
The initial height, s, is 48 feet. The initial velocity, v, is 32 ft/sec.
Step 2. State what these values represent.
Revenue Problems
Example Use the table and graph below (created from the equation above) to determine the price that will provide the maximum revenue for the bike shop.
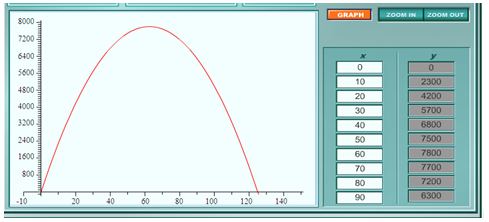
The vertex is (62.5, 7812.5).
Step 2. Use the vertex to answer the question.
Since the graph opens down, the vertex will be the maximum value. This is the point where the price will yield the maximum revenue. This means the maximum revenue is $7,812.50 and the price that will produce this maximum revenue is $62.50 per bike.
Area Problems
Example A rancher needs to construct a rectangular stock pen, using the local creek as one of the sides. The other three sides can be constructed out of 800 meters of fencing material (see the diagram below). He can make the stock pen a variety of shapes - long and thin, short and fat, square or any shape in between. Create a quadratic equation and graph that can be used to determine which rectangular shape will give him the maximum area. Then answer the following questions: What is the domain and range? For what values of length is the area zero? For what value of length is there a maximum area?

The perimeter of the rectangular pen has the formula, P = 2w + 1l. Since there is 800 feet of fence to use, the formula for the perimeter is 800 = 2w + l. Solve this formula for l to find an expression that will represent the length of the fence.
2w + l = 800
l = 800 - 2w
Step 2. Determine a quadratic equation that will model the area of the pen.
Example Continued
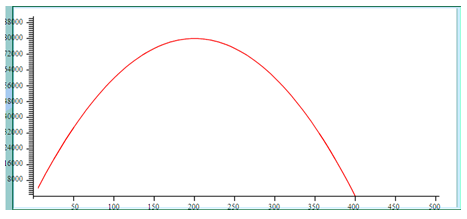
Step 4. Answer the questions.
- What is the domain?
- Since the inputs are based on width, the domain is all real numbers greater than or equal to 0;
 .
.
- Since the inputs are based on width, the domain is all real numbers greater than or equal to 0;
- What is the range?
- Since the outputs are based on area, the range is all real numbers greater than or equal to 0;
 .
.
- Since the outputs are based on area, the range is all real numbers greater than or equal to 0;
- For what values of l is the area zero?
- This question is asking for the output to be zero, in other words the x-intercepts, which are (0, 0) and (0, 400).
- For what value of l is there a maximum area?
- This question is asking for the maximum value, in other words the vertex, which is (200, 80,000). The value of l that results in the maximum area is 200 feet.
Sources
Embracing Mathematics, Assessment & Technology in High Schools; A Michigan Mathematics & Science Partnership Grant Project
"Here's Everything in One Picture." http://www.mathnstuff.com/math/ spoken/here/2class/320/qmotion.htm (accessed 08/09/10).
Jefferson Math Project, http://www.jmap.org/htmltopics/QUADRATICS/ jmap_by_topic_Graphing_Quadratics.htm (accessed 08/08/10).
