Graphical Behavior
| Site: | Harrison |
| Course: | Michigan Algebra I Sept. 2012 |
| Book: | Graphical Behavior |
| Printed by: | Guest user |
| Date: | Sunday, 21 December 2025, 2:22 PM |
Description
Introduction
Exponential functions are different from other functions studied in this course because the variable appears as the exponent instead of the base. In general an exponential function takes the form: y = a · bx, where x is a real number, a ? 0, b > 0, and b ? 1. The value of a is the initial amount, or y-intercept, and b is the common ratio. It is called a common ratio because every time x is increased by a factor of one, the expression gets multiplied by the value of b.
Exponential Curves
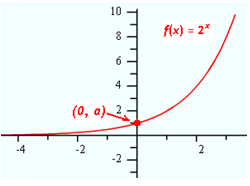
The graph of f(x) = 2x is below. The value of a is 1 and b is 2. Notice that the curve intersects the y-axis at 1, or the value of a, and that the curve is increasing from left to right. The curve approaches but never intersects the x-axis, so the x-axis is an asymptote of the curve.
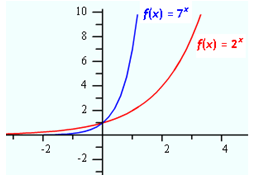
The curve above is an example when the value of b is greater than 1. What happens to the curve as the value of b increases? The graph below shows how the curve changes as the value of b increases. Notice that the y-intercept remains the same, but the curve gets steeper from left to right.
Changing b
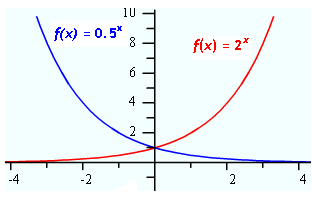
The restriction on the exponential function says that b has to be greater than 0. The curve has been explored for values greater than 1. What happens to the curve when b is between 0 and 1? The graph below shows how the curve changes with varying values between 0 and 1. The intercept remains the same, but the curve has been reflected across the y-axis and decreases from left to right.
Changing a
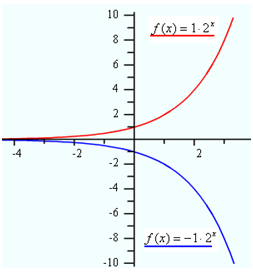
Now consider the effect that the value of a has on the exponential curve. The value of a determines where the curve crosses the y-axis. The graph below displays the curves of three exponential functions with the same base, but with varying positive values of a. Notice that the y-intercept is the same value as a and that the overall shape of the curve does not change. When a is positive the curve will increase from left to right.
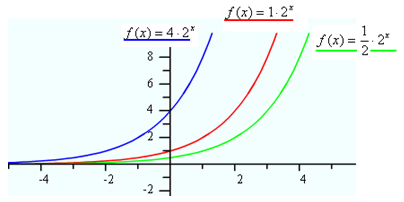
What happens to the curve when a is negative? The following graph demonstrates the effect of a negative value for a. The curve still intersects the y-axis at the value of a, but the curve has now been reflected across the x-axis and the function decreases from left to right.
Graphical Similarities
The graphs of exponential equations have some similarities. All of the curves graphed in this book pass the vertical line test. They also pass the horizontal line test. Therefore, the exponential curve and the inverse curve are both functions. There was never a restriction on what values could be used for x, so the domain of exponential functions is all real numbers. The range will depend on the value of a. When a is positive, then the range is all positive real numbers. When a is negative, the range is all negative real numbers. Domain and range will be presented in further detail in this unit. All exponential curves have an asymptote. The asymptote will change depending on the values within the equation and will be explored further a little later.
There are some other situations left unexplored, such as the case of y = ab(x-h) + k . The curve will be shifted according to the values of h and k. This situation will be presented later in this unit.
Video Lesson
To learn how to identify an exponential function, select the following link:
Asymptotes
An asymptote is a line that a curve approaches but never crosses. The asymptote for all of the curves presented in this book so far is the line y = 0, since the curves approach the x-axis, but do not touch or cross the line. This is also called the horizontal asymptote. Sometimes making a dotted line to represent the asymptote will help to draw the curve more accurately.
The graph below represents the function, y = 2x + 4. Notice that the points on the graph are approaching, but never touching, the line y = 4. Therefore, y = 4 is the asymptote line for this function.
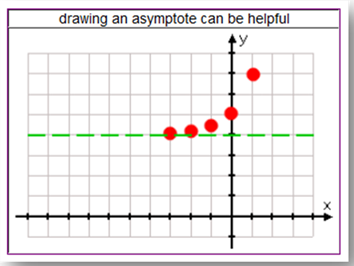
Notice in the graph above that the y-intercept is not equal to the a value of the equation. When a value is added to an exponential equation, the curve is shifted. This situation will be discussed in the "Transformations" book later in this unit.
Video Lessons
To watch a video lesson on how to graph exponential functions, select the following link:
Graphing Exponential Functions
Graphing Behavior of Exponential Functions
Guided Practice
To solidify your understanding of graphing exponential functions, visit the following link to Holt, Rinehart and Winston Homework Help Online. It provides examples, video tutorials and interactive practice with answers available. The Practice and Problem Solving section has two parts. The first part offers practice with a complete video explanation for the type of problem with just a click of the video icon. The second part offers practice with the solution for each problem only a click of the light bulb away.
Practice
Graphing Exponentials Worksheet
*Note:If Google Docs displays "Sorry, we were unable to retrieve the document for viewing," refresh your browser.
Answer Key
Graphing Exponentials Answer Key
*Note:If Google Docs displays "Sorry, we were unable to retrieve the document for viewing," refresh your browser.
Sources
Gloag, Anne & Andrew. "Exponential Functions." February 24, 2010.http://www.ck12.org/flexr/chapter/4478
Holt, Rinehart & Winston, "Graphing Exponential Functions ." http://my.hrw.com/math06_07/nsmedia/lesson_videos/msm3/player.html?contentSrc=6302/6302.xml (accessed 9/15/2010).
Holt, Rinehart, & Winston. "Sequences & Functions."http://my.hrw.com/
math06_07/nsmedia/homework_help/msm3/msm3_ch13_05_homeworkhelp.html (accessed September 11, 2010).
Roberts, Donna. "Exponential Functions."http://www.regentsprep.org/
Regents/math/algtrig/ATP8b/exponentialFunction.htm (accessed September 3, 2010)
Stapel, Elizabeth. "Graphing Exponential Functions. "http://www.purplemath.com/modules/graphexp.htm (accessed September 11, 2010).
