Absolute Value
Absolute Value Functions
Transformations
Example
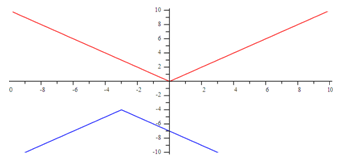
Graph the function f(x) = - Ix + 3I - 4. Explain how this graph would compare to the parent function.  The red graph represents the parent function. The blue graph represents the translation function.
Step 1. Explain the a-value.
Since a = -1, the graph is reflected across the x-axis.
Step 2. Explain the h-value.
Since h = -3, the graph will translate 3 units left.
Step 3. Explain the k-value.
Since k = -4, the graph will translate 4 units down.
Step 4. Make a graph.
